MYSQL MONITORING GUIDE: USING MYSQLD_EXPORTER, PROMETHEUS AND GRAFANA FOR EASY MYSQL DATABASE MONITORING
Time to read: 30 minutes
In the previous blog we learnt how to setup cAdvisor for container monitoring. Likewise in case of mysql database monitoring, we need client agent similar to cAdvisor.
We will use mysqld_exporter as a client agent and set it up in ubuntu server directly. We wont be setting mysqld_exporter in container this time. It can get MySQL metrics and export it to Prometheus server.
Then, we can easily perform mysql database monitoring using grafana by visualizing various mysql metrics such as mysql uptime, Query per second (QPS), total number of connections, etc. All these metrics are pulled by grafana from prometheus.
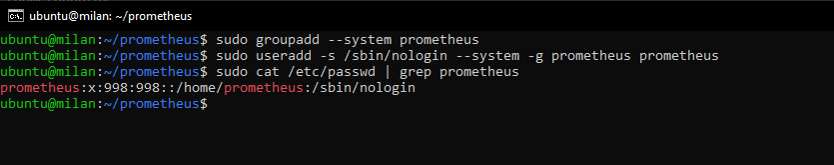
PART 1: CREATING A USER FOR MYSQL MONITORING AGENT:
sudo groupadd --system prometheus
sudo useradd -s /sbin/nologin --system -g prometheus prometheus
Now lets download mysql exporter and install it:
curl -s https://api.github.com/repos/prometheus/mysqld_exporter/releases/latest | grep browser_download_url | grep linux-amd64 | cut -d '"' -f 4 | wget -qi -
tar xvf mysqld_exporter*.tar.gz
sudo mv mysqld_exporter-*.linux-amd64/mysqld_exporter /usr/local/bin/
sudo chmod +x /usr/local/bin/mysqld_exporter
mysqld_exporter --version
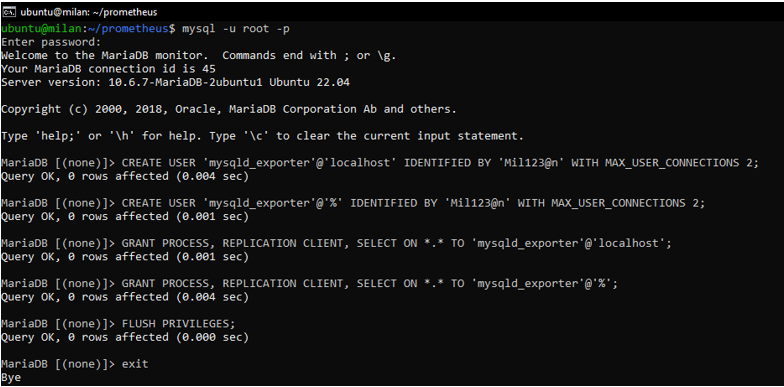
PART 2: CREATE PROMETHEUS EXPORTER DATABASE USER:
Login to your mysql as root and create a user with PROCESS, SELECT, REPLICATION CLIENT grants:
CREATE USER 'mysqld_exporter'@'localhost' IDENTIFIED BY 'YourPassword' WITH MAX_USER_CONNECTIONS 2;
CREATE USER 'mysqld_exporter'@'%' IDENTIFIED BY 'YourPassword' WITH MAX_USER_CONNECTIONS 2;
GRANT PROCESS, REPLICATION CLIENT, SELECT ON *.* TO 'mysqld_exporter'@'localhost';
GRANT PROCESS, REPLICATION CLIENT, SELECT ON *.* TO 'mysqld_exporter'@'%';
FLUSH PRIVILEGES;
EXIT
Here, WITH MAX_USER_CONNECTIONS 2 is used to set a max connection limit for the user to avoid overloading the server with monitoring scrapes under heavy load.
PART 3: CONFIGURE DATABASE CREDENTIALS
Create a database credentials file which will be used by mysqld_exporter to access out database.
sudo nano /etc/.mysqld_exporter.cnf
Now paste the following content inside it and modify as per your needs:
[client]
user=mysqld_exporter
password=YourPassword
Save the file and set ownership permissions and give access to prometheus:
sudo chown root:prometheus /etc/.mysqld_exporter.cnf
PART 4: CREATE SYSTEMD UNIT FILE ( FOR SYSTEMD SYSTEM犀利士 S )
We will install mysqld_exporter as a service and it will always be started on boot for uninterrupted mysql monitoring:
Create a new service file:
sudo nano /etc/systemd/system/mysql_exporter.service
Add the following content:
[Unit]
Description=Prometheus MySQL Exporter
After=network.target
User=prometheus
Group=prometheus

[Service]
Type=simple
Restart=always
ExecStart=/usr/local/bin/mysqld_exporter
--config.my-cnf /etc/.mysqld_exporter.cnf
--collect.global_status
--collect.info_schema.innodb_metrics
--collect.auto_increment.columns
--collect.info_schema.processlist
--collect.binlog_size
--collect.info_schema.tablestats
--collect.global_variables
--collect.info_schema.query_response_time
--collect.info_schema.userstats
--collect.info_schema.tables
--collect.perf_schema.tablelocks
--collect.perf_schema.file_events
--collect.perf_schema.eventswaits
--collect.perf_schema.indexiowaits
--collect.perf_schema.tableiowaits
--collect.slave_status
--web.listen-address=0.0.0.0:9104

[Install]
WantedBy=multi-user.target
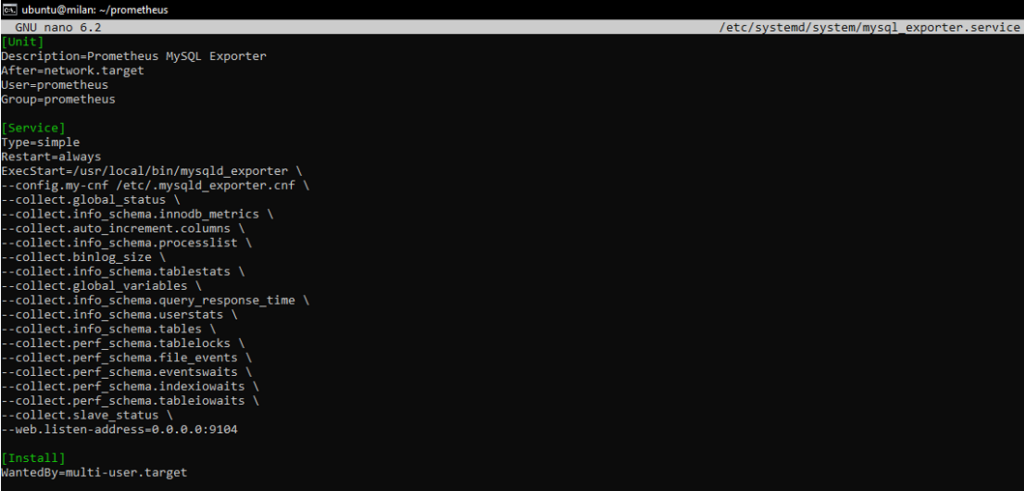
Change --web.listen-address=0.0.0.0:9104 to different IP and port as per your needs.
When done, reload systemd and start mysql_exporter service:
sudo systemctl daemon-reload
sudo systemctl enable mysql_exporter
sudo systemctl start mysql_exporter
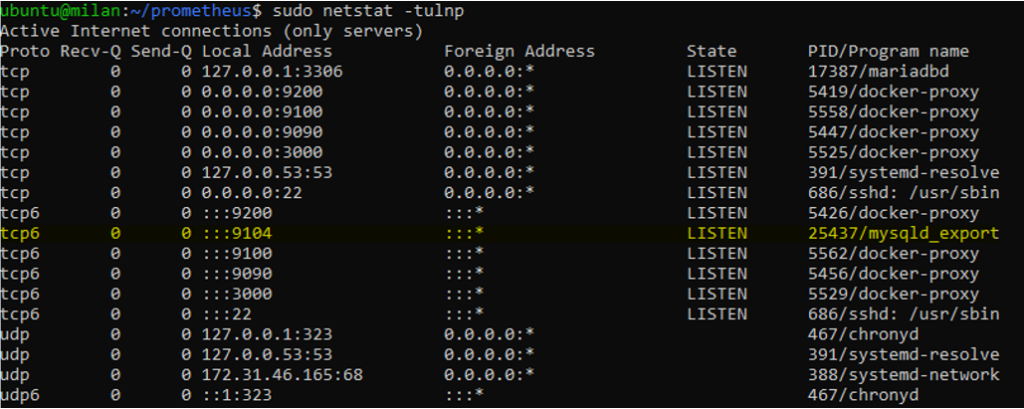
Check if it is running and listening on correct ip and port:
sudo netstat -tulnp
PART 5: CONFIGURE MYSQL ENDPOINT TO BE SCRAPED BY PROMETHEUS SERVER
We need to add some configs in the config file for Prometheus that we created previously.
sudo nano config/prometheus.yml
Add the following code inside it:
- job_name: 'mysql_exporter'
    static_configs:
      - targets: ['host.docker.internal:9104']
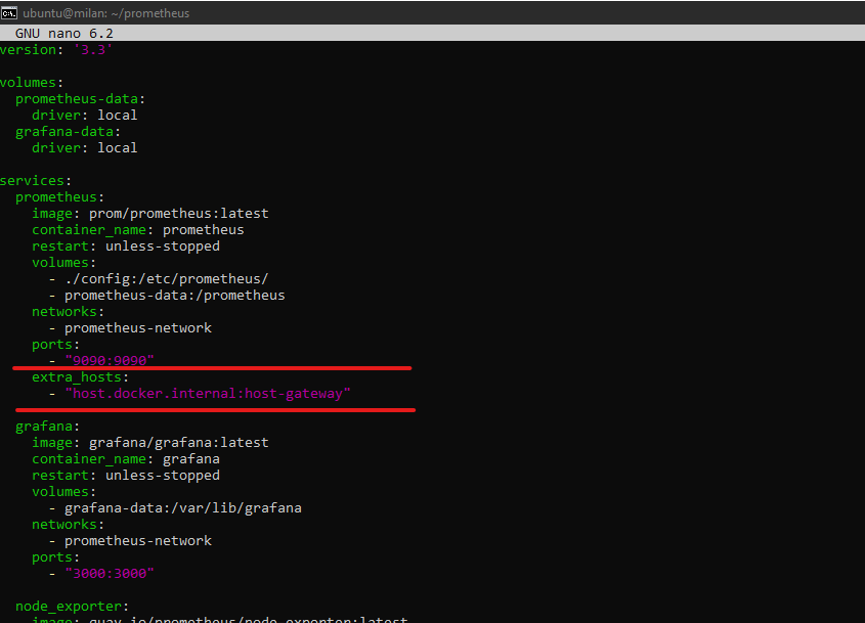
Our config should look like this:

In above config file my target ip address is host.docker.internal. It is because mysqld_exporter is not in the same network as prometheus. So I have mapped localhost of my server with prometheus host.docker.internal.
Check this updated docker-compose config file. You need to add some configs in our previous docker compose file:
extra_hosts:
      - "host.docker.internal:host-gateway"
Now lets rebuild and restart our containers:
sudo docker-compose up -build -d
sudo docker-compose restart prometheus
Now go to http://yourserverip:9090/ to access Prometheus:
Go to Status->targets.
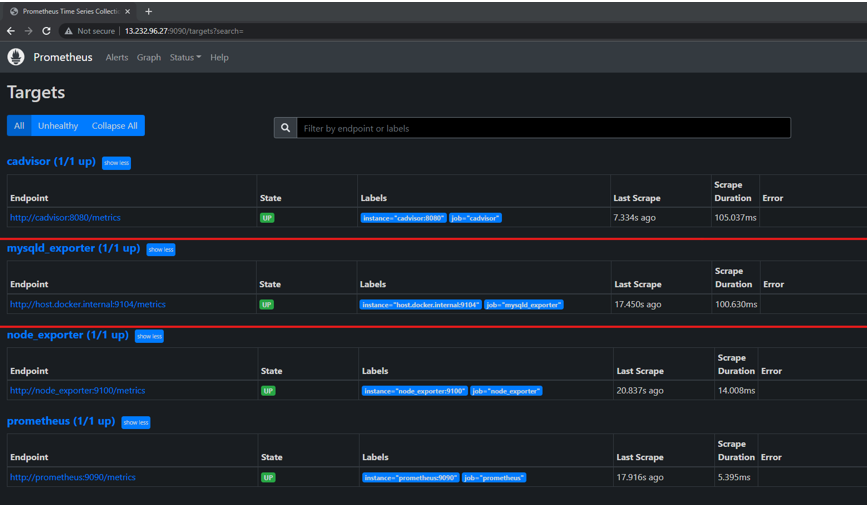
Here we can see that mysqld_exporter is up.
Now Let’s login to our grafana server.
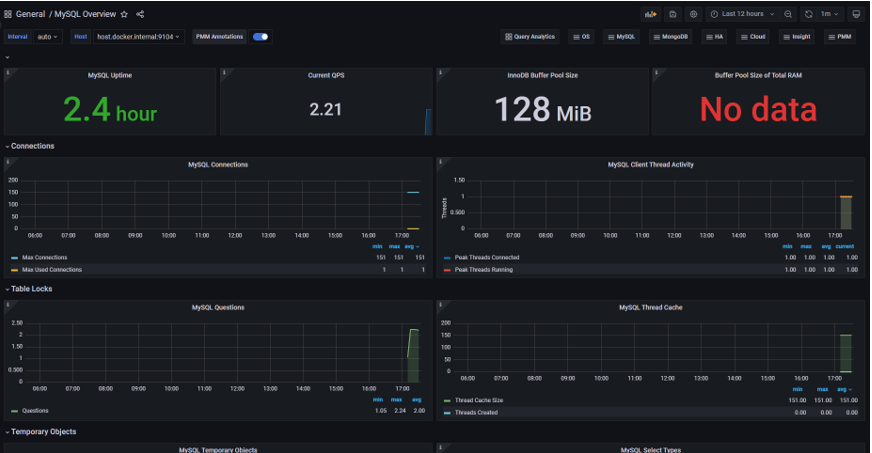
And let’s setup our dashboard for mysql monitoring.
Go to import and import a dashboard. You can use ID 7362. Check my previous blog if you are confused.
After importing you should see a dashboard like this:
THATS IT!! YOU HAVE SUCCESSFULLY SETUP MYSQL DATABASE MONITORING!
In my next blog i will teach you how to add alerts whenever any abnormality in detected in your server.